Every mechanical permit filed in New Jersey carries a dollar figure. So does every residential permit application in the City of Orlando, and every trade permit the City of Seattle issues. All three publish them. Nobody reads them, because three quarters of a million rows of municipal fee codes is not anyone’s idea of an evening.
We read them. Six years, 765,084 permits, filtered down to residential alteration work — the changeouts and replacements, not new construction. What came back is the clearest answer available to the question this whole site exists for, and it is not the answer most homeowners expect.
The short answer
For the most common job in the dataset — a furnace and AC replacement, filed with both mechanical and electrical subcodes — the middle half of New Jersey permits runs from $6,500 to $13,938, with a median of $10,000.
That is the finding. Not the median. The spread.
Half of all such jobs fall inside a band more than twice as wide at the top as at the bottom. Six percent came in under $3,000. Three percent came in over $25,000. Same job shape, same state, same two-year window.
So when you ask “is $11,400 a fair price for a furnace and AC,” the honest answer is that $11,400 sits comfortably inside the normal range — and so does $7,000, and so does $13,500. The range is the answer. Anyone who gives you a single number and calls it the fair price is describing a distribution they have not looked at.
Why it works that way
The instinct is to read that spread as chaos — some homeowners being fleeced, others getting away with something. Some are. But most of that band is real, and it is real for reasons that are invisible on a quote.
A permit records a job. It does not record the house. Inside that $6,500-to-$13,938 band sit two-ton systems and five-ton systems, ninety-six percent furnaces and eighty percent furnaces, basements you can stand up in and crawlspaces you cannot, jobs where the line set was reusable and jobs where it was not, towns with a two-hundred-dollar permit fee and towns with an eight-hundred-dollar one. The dataset flattens all of it into one number, because a permit clerk does not care why your job cost what it cost.
Which means the spread is not proof of widespread overcharging. It is proof that “the going rate” is not a thing that exists. It is a shape, and your house sits somewhere inside it for reasons a good contractor can name and a bad one will not.
The second finding is the one that surprised us. Between 2021 and 2026, the median furnace-and-AC permit rose from $7,800 to $10,400 — up 33 percent. That is steep. But over the same six years:
- Mechanical-only permits — a furnace or an AC on its own, no electrical work — went from $1,625 to $2,495. Up 54 percent.
- Plumbing-only permits — water heaters, repipes, fixture work — went from $1,569 to $2,358. Up 50 percent.
The small jobs inflated substantially faster than the big ones.
That runs against the usual story, which blames equipment: refrigerant transitions, efficiency mandates, tariffs on compressors. Those are all real, and every one of them should have hit the large jobs hardest, because equipment is the largest share of a large job. Instead the opposite happened.
The explanation that fits is that the fastest-rising component is not the equipment at all. It is the cost of putting a qualified person in a truck and sending them to your house. On a $10,000 changeout that is a slice of the total. On a $2,000 water heater swap it is most of the invoice — which is exactly why the small job moved more.
If you have ever wondered why a job that felt like it should be cheap quoted like it wasn’t, that is the arithmetic behind it.
The cross-check, and the one that disagreed
One state proves nothing. New Jersey has its own labor market, its own code cycle, and a state regulation requiring every municipality to report — which is precisely why the dataset is good, and also why it might be peculiar.
So we ran the same analysis against the City of Orlando: different state, different climate, different dataset, different fields, and a completely different method of working out what the job actually was.
Orlando’s median residential mechanical replacement is $10,264. New Jersey’s is $10,000.
Two datasets sharing no infrastructure, assembled by different governments for different reasons, landed 2.6 percent apart. Orlando’s middle half runs $7,583 to $13,790 — very nearly New Jersey’s band. Its six-year inflation on that shape was 59 percent, steeper than New Jersey’s 33.
Then we ran a third, and it did not agree.
Seattle publishes every trade permit its inspections department issues, and its median residential heating-and-cooling job is $8,000 — about twenty percent below the other two. That is a real gap, not a rounding difference, and it survived the first thing we checked.
The obvious explanation is that Seattle buys different equipment. It is a mild, largely duct-free market where a ductless mini-split is the common retrofit, and a mini-split is a smaller job than a ducted furnace-and-AC changeout. If that were the answer, the cheap half of the city would be the ductless half.
It isn’t. Splitting 25,938 Seattle jobs by what the permit says was installed, the ductless ones run an $8,500 median and the ducted ones $8,000. The ductless work is the dearer half, and both sit below New Jersey and Orlando. Whatever is going on in Seattle, it is not a mix effect.
We said at the top that the spread is the finding. This is the same lesson one level up: three governments measuring the same kind of work, and the answer still moves by a fifth depending on which city you stand in. A national “fair price” for a furnace and AC does not exist either.
We did not expect the first two to agree that closely, and we said we would publish it if they hadn’t. The third one didn’t, so here it is.
What this cannot tell you, and why we won’t pretend otherwise
Here is the part most articles built on public data leave out.
The dollar figure on a permit is the applicant’s own declared value of the work. It is not a contractor’s proposal price. Some applicants declare the contract price. Some declare their own cost. Some round to the nearest thousand. Nothing in the statute or the software enforces a convention, and there is no field telling you which one you are looking at.
That has a hard consequence: you cannot subtract. “The permit median is $10,000, I was quoted $12,000, therefore I am 20 percent over” is arithmetic performed on two different quantities, and it will tell you that you are being robbed on evidence that cannot support the claim. Our own Quote X-Ray is built so that it structurally cannot report a percentage against permit data — there is no field in the code to put that number in, specifically so that no future version of the tool can quietly start implying one.
The rest of the fine print, stated plainly: neither dataset has a field naming the work, so job shape is inferred — in New Jersey from which subcode fees are non-zero, in Orlando from the permit type on the application. New Jersey’s DCA states its data is unaudited and may be incomplete, the two most recent months are unreviewed, and eight municipalities report nothing at all. Orlando is one city of about 320,000 people, not the state of Florida, and nothing in it describes Miami.
What permit records are good for is the shape: how wide the band is, where the bulk of it sits, and which direction it has been moving. That is genuinely useful, and it is all we claim.
What to ask
Take the band to your contractor rather than the median.
- “My quote is toward the high end of what this job usually runs. What about my house puts it there?” A real answer names something physical — the tonnage, the venting run, a panel that needs work, a line set that can’t be reused. This is the most useful question in this article.
- “What’s the equipment, and what’s everything else?” The spread lives in the “everything else.” A contractor who can split it can defend it.
- “Is the permit fee inside this number or on top of it?” Small money, but the answer tells you whether a permit is being pulled at all — which matters for reasons well beyond price.
What a bad answer sounds like
“That’s just what it costs right now.”
It is not what it costs right now. It is what your job costs, and the hundred-and-thirty-eight-thousand-permit range around it says there is a specific reason yours landed where it did. A contractor who has genuinely estimated your house can name that reason in one sentence. One who is reading a price off a laminated card cannot, and will reach for the economy instead.
The tell is direction. A good answer points at your house. A bad answer points at the market.
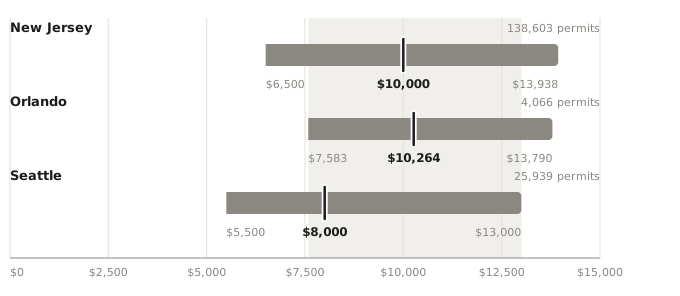
Each band is the middle half of that place’s permits — a quarter of jobs cost less, a quarter cost more — with the median marked. The three medians are not the same, and Seattle’s runs a fifth below the other two. But the bands sit almost on top of one another: everything from $7,583 to $13,000 is an ordinary number in all three places. Three governments that share no infrastructure, no building code and no labour market, describing the same range. That is the part worth carrying away, and it is only visible because these are bands rather than three medians on a chart.
New Jersey figures: NJ Department of Community Affairs construction permit
data (dataset w9se-dmra), residential R-3/R-5 alterations, pulled 27 August
2026. Orlando figures: City of Orlando permit applications (dataset
ryhf-m453), residential 1/2 repair and alteration work, pulled the same day.
Seattle figures: City of Seattle SDCI trade permits (dataset c87v-5hwh),
residential furnace, refrigeration and mechanical permits, pulled 28 August
2026. Seattle issues a separate permit per trade and a single job is often
filed as two, so its figures count jobs — collapsed by address and day — rather
than permits.
Quartiles and medians describe permits filed from January 2024 onward; the
six-year comparisons run 2021 to 2026. Both sources are open data.